Your social media strategy shouldn’t be a guessing game. But if you’re posting without regularly checking what’s working and what’s not, you’re flying blind.
That’s why a social media SWOT analysis is one of the smartest moves you can make.
In this blog, Olivia Reck, Account Specialist, will explain how this simple, structured approach helps you see exactly where you stand and how to improve.
What You’ll Learn:
- Why Run a Social Media SWOT Now?
- What You Need Before You Begin
- How to Conduct SWOT for Social Media
- Turning SWOT Insights Into Strategy
- When to Revisit Your SWOT (and Who Should Be Involved)
- How Rallio Supports SWOT-Driven Strategy
- FAQs
What is a Social Media SWOT Analysis?
SWOT stands for Strengths, Weaknesses, Opportunities, and Threats. Originally designed for business strategy, it translates perfectly to social media.
Here’s how it applies to your social channels:
- Strengths are what you’re already doing well. It’s your best-performing content, your engaged community, your creative edge.
- Weaknesses are the gaps. Things that get low reach on certain platforms, inconsistent posting, or outdated visuals.
- Opportunities are the things you haven’t tapped into yet, such as new platforms, trending formats, or underserved audiences.
- Threats are external forces that could hurt your performance, including algorithm updates, rising competition, or shifting user behavior.
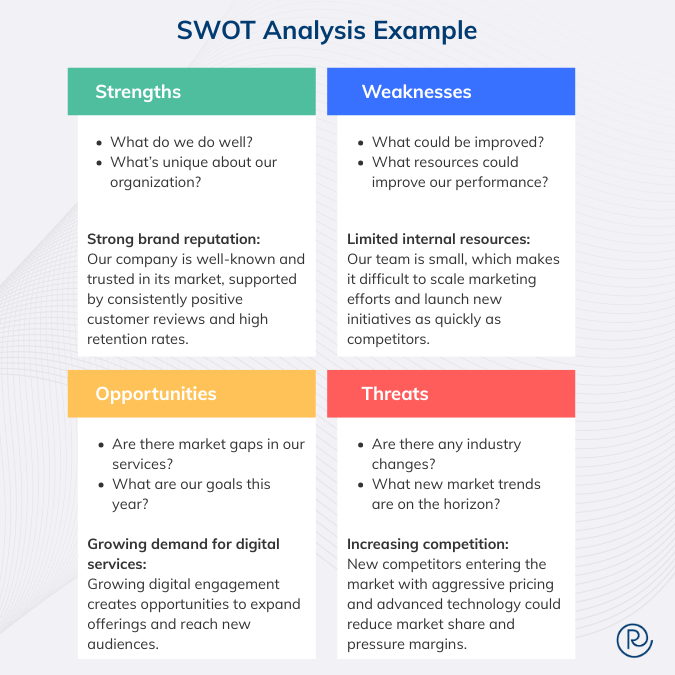
A marketing SWOT analysis blends hard data with strategic thinking. You’re not just looking at numbers. You’re interpreting what those numbers mean for your brand’s future. It’s about understanding content performance, engagement trends, brand presence, and how you stack up against competitors. This combination makes SWOT one of the most practical tools in your marketing toolkit.
Expert Opinion on the Need for SWOT for Social Media
Too many brands post content without understanding why some posts fly while others flop, but if you want to find success, you have to have a strategy. A SWOT for social media gives you a clear picture of your current position. It helps you spot patterns you might otherwise miss.
When you assess your strengths, weaknesses, opportunities, and threats, you’re not just collecting data. You’re building a roadmap. You’re making informed decisions instead of reactive ones.
This framework has been used in business for decades, and it works just as well for social media. Whether you’re a solo marketer or part of a large team, SWOT brings structure to the chaos. It turns vague feelings into actionable insights and helps you figure out where to take your social media marketing strategy next.

Why Run a Social Media SWOT Now?
There are a few big reasons to run a SWOT analysis today. Let’s look at the four major reasons:
- It gives you clarity. No more guessing why one campaign crushed it while another failed.
- It helps you align your social efforts with your business goals. If your company wants to grow brand awareness, but your social strategy focuses only on sales posts, there’s a disconnect. SWOT helps you spot and fix that.
- It reveals new ideas. Maybe there’s a platform you haven’t tried yet. Or a content format your audience loves that you’re not using enough. SWOT uncovers those opportunities so you can act on them.
- It prepares you for challenges. Threats in SWOT analysis might include algorithm changes, new competitors, or shifts in user behavior. When you identify these early, you can plan ahead instead of scrambling later.
So, when should you run a SWOT?
- When you’re launching a rebrand or a major campaign
- During quarterly or annual reviews
- When your results have gone flat
- When you just need a fresh perspective on your strategy
You don’t need a specific reason to run a social media SWOT analysis, but these are all perfect moments to pause and assess.
What You Need Before You Begin
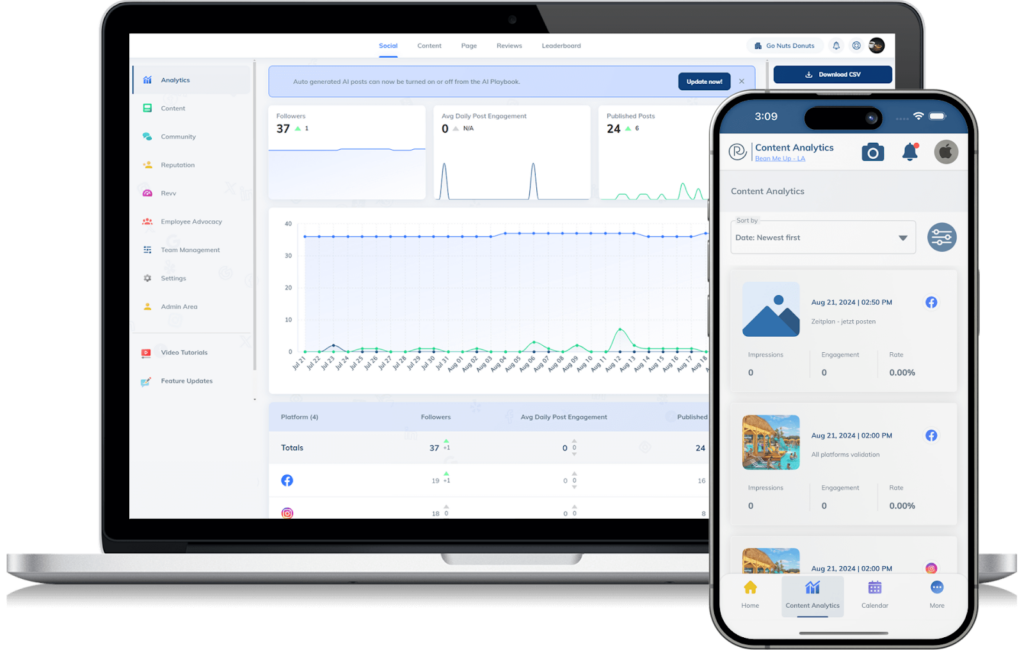
Before you dive into your analysis, gather the right information. Look at the core social analytics that will tell the story of how your content is performing: engagement rates, reach, follower growth, and conversions.
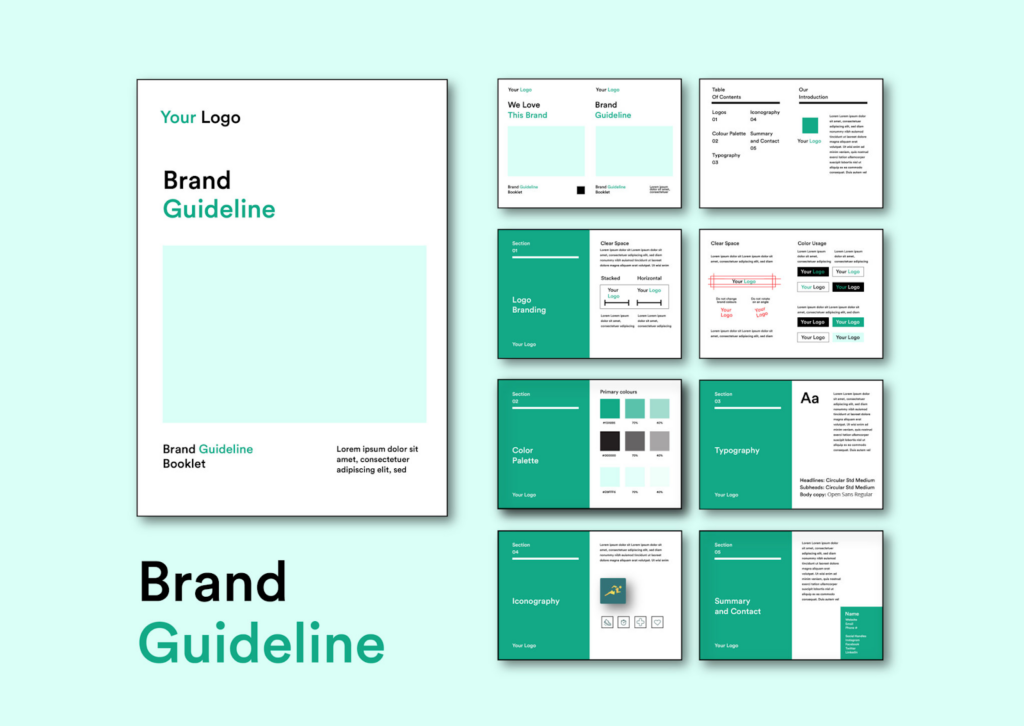
Without context, data doesn’t mean much, so the next step is to pull together your brand guidelines and strategic goals. Knowing what you’re trying to achieve helps you interpret the numbers correctly.
Next, pull your audience insights. What are the demographics, behaviors, and interests of your followers? How do they feel about your brand? Sentiment matters just as much as follower count.
Don’t skip the competitive research. Look at what others in your space are doing well and where they’re falling short. This will help you learn from the landscape.
Finally, if you have access to social listening tools, review data, or community feedback, bring that in too. Real comments and conversations often reveal insights that raw numbers can’t.
How to Conduct SWOT for Social Media
Now let’s walk through each part of the framework. Take your time with this. The more honest and thorough you are, the better your results will be.
What Are Your Strengths?
Start with what’s going right. Which platforms are bringing you the best results? Is Instagram your engagement superstar? Does LinkedIn drive the most quality leads? Identify your winners.
Look at content formats too. Maybe your how-to videos always get shared. Or your carousel posts outperform single images. These are strengths worth doubling down on.
Don’t forget internal strengths. Do you have a clear, recognizable brand voice? A consistent posting schedule? A talented creative team? Strong community engagement or positive brand sentiment? All of these count. Write them down. Celebrate them. Then think about how to leverage them even more.
What Are Your Weaknesses?
Now, it’s time to look at where you’re falling short. It is entirely normal for this part to be challenging, but you have to be honest with yourself if you want your marketing SWOT analysis to actually work.
Some common weaknesses include:
- Inconsistency
- Outdated content
- Lack of video content
- Limited resources
- Lack of strategy
- Unclear goals
- Convoluted messaging
Once you’ve identified your gaps, you can begin addressing them.
What Are Your Opportunities?
Now, you can start identifying areas to improve your social media presence. Consider things like:
- New platforms that could align with your audience
- Content trends you haven’t explored
- Untapped audience segments
- Partnering with influencers
- Encouraging user-generated content
- Incorporating new analytics tools
A marketing SWOT analysis example might include opportunities such as launching a podcast, going live more frequently, or testing a new ad format.
What Are Your Threats?
Finally, look at the external challenges. Algorithm changes are a constant threat. Platforms like Instagram and Facebook tweak their algorithms regularly, and it can tank your reach overnight.
Competitor activity is another big one. If a rival brand is ramping up its social presence or outspending you on ads, that’s a threat.
Shifts in audience behavior, such as younger users abandoning certain platforms or privacy concerns reducing data availability, can also be threats in your SWOT analysis.
Don’t ignore economic factors either. Budget cuts, industry downturns, or brand-safety issues can all impact your social strategy. The goal isn’t to panic. It’s to be aware so you can plan accordingly.
Turning SWOT Insights Into Strategy
A social media SWOT analysis is only useful if you act on it. Once you’ve filled out all four quadrants, it’s time to prioritize. Look at your list and ask: what will have the biggest impact with the least effort?
Pick a few high-priority items and turn them into measurable goals. Instead of “post more,” try “publish three Reels per week for the next quarter.” Specificity makes it easier to track progress.
Adjust your content calendar based on what you learned. If carousel posts are a strength, schedule more. If Twitter isn’t delivering results, scale back and focus elsewhere. If a threat, such as algorithm changes, is looming, diversify your platforms so you’re not overly reliant on any one.
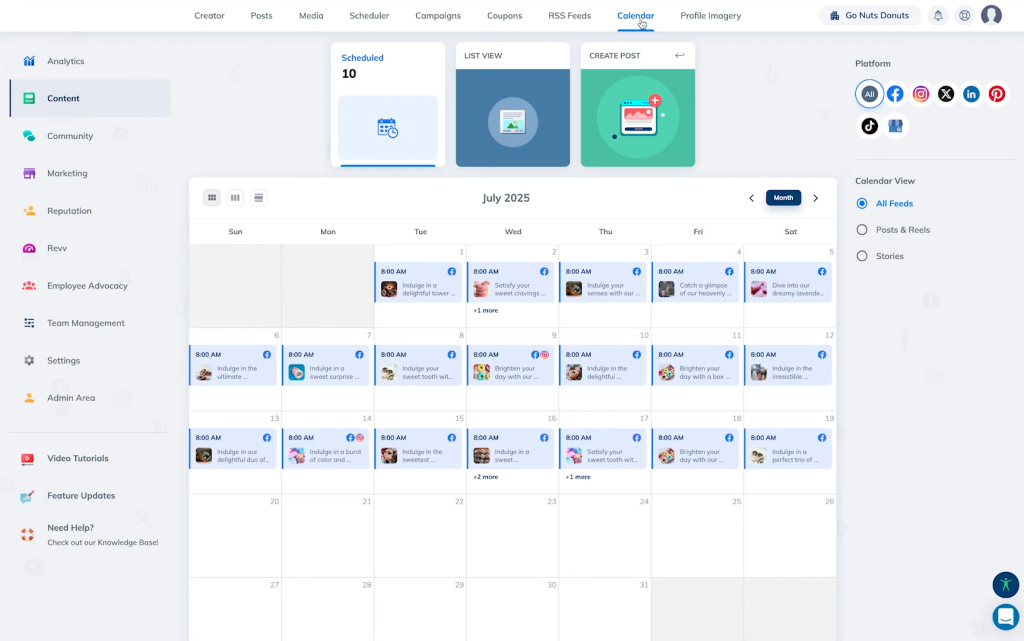
Also consider where you might need additional resources, such as a scheduling tool to maintain consistency, a designer to refresh your visuals, or training on a new platform. Identifying these needs now helps you plan your budget and bandwidth.
When to Revisit Your SWOT (and Who Should Be Involved)
SWOT isn’t a one-and-done activity. Plan to revisit it at least quarterly or twice a year. Social media changes too fast to set it and forget it.
You should also run a fresh analysis after major campaigns, rebrands, or significant performance shifts. If something big changes, take the time to reassess.
Make this a team effort. Your social media manager should lead it, but bring in your marketing lead, content creators, and anyone with access to data and analytics. Different perspectives make the analysis richer and more accurate.
How Rallio Supports SWOT-Driven Strategy
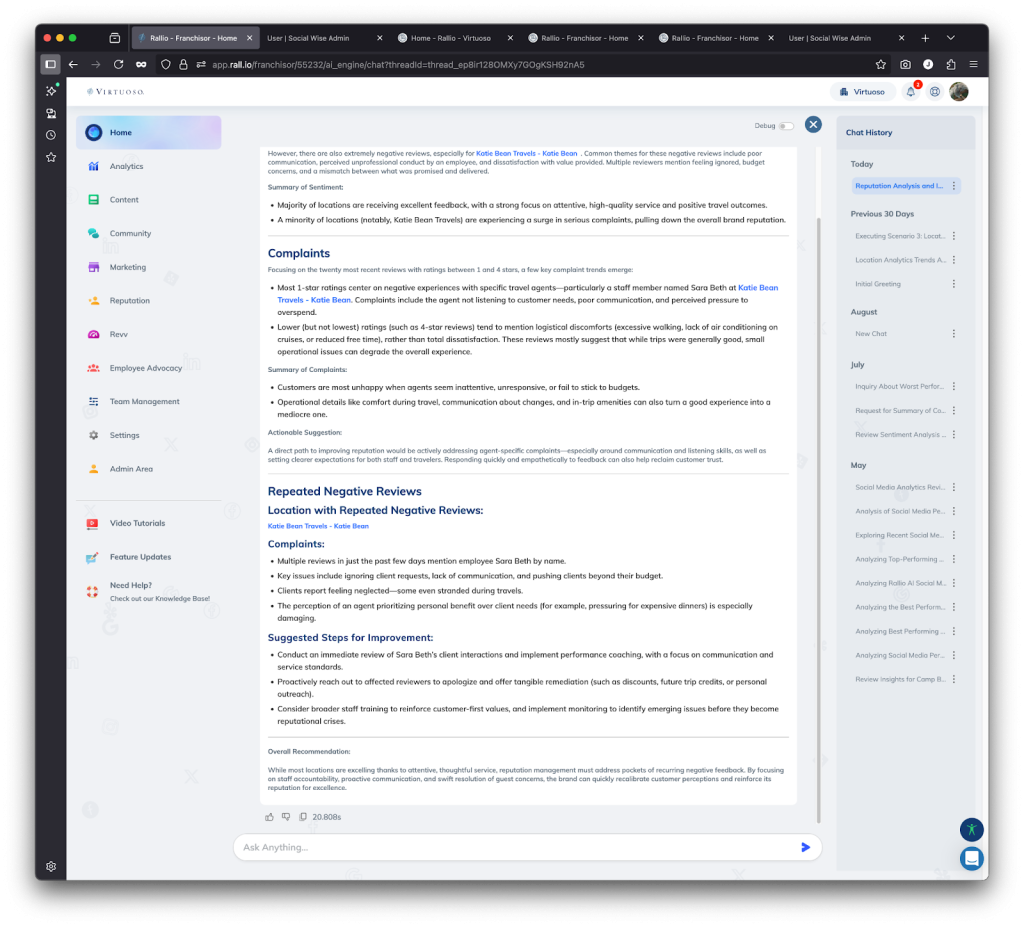
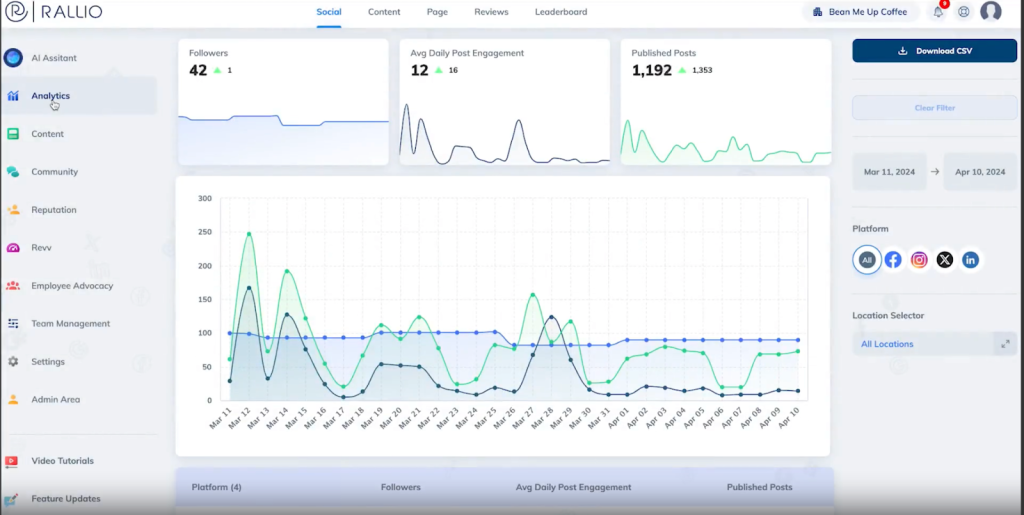
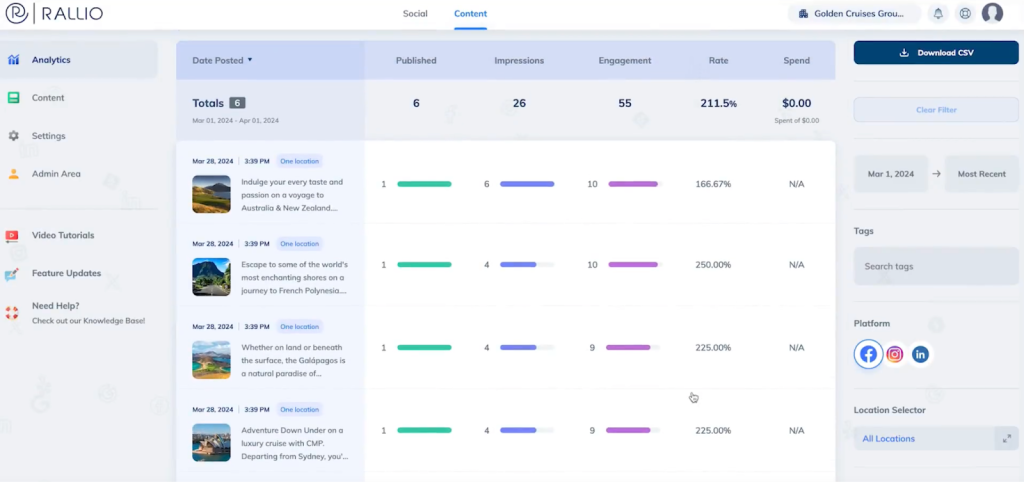
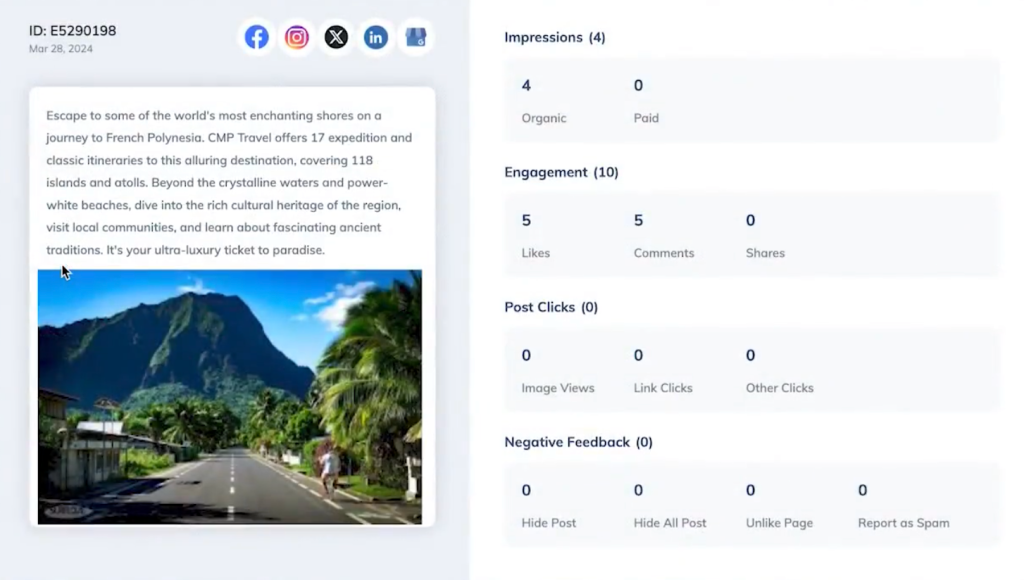
Conducting a thorough SWOT analysis is easier with the right tools. Rallio gives you the performance data you need to understand your strengths and weaknesses. With built-in analytics dashboards, you can track engagement, reach, and conversions across all your channels in one place.
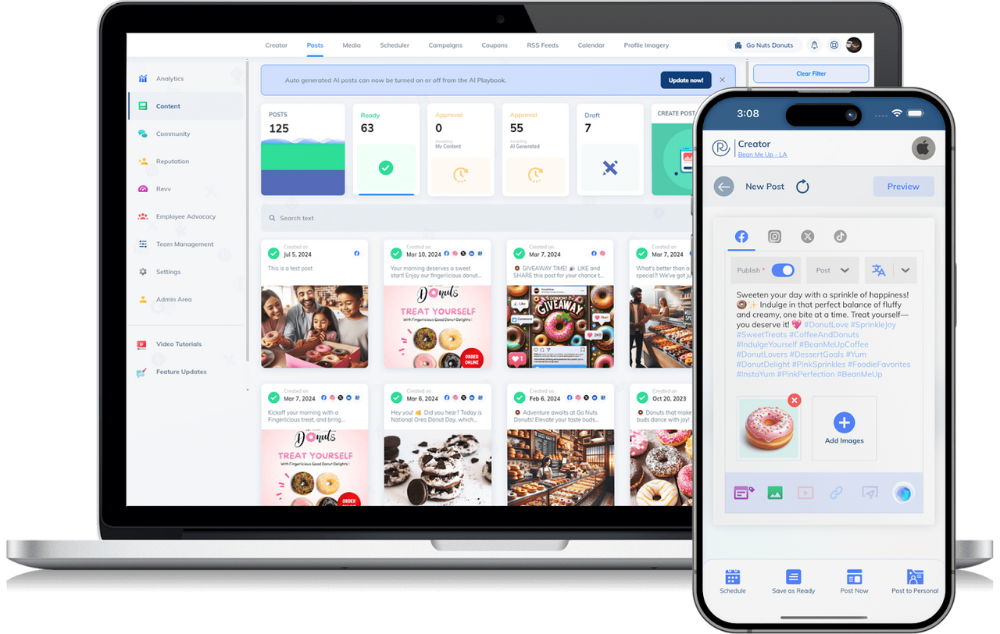
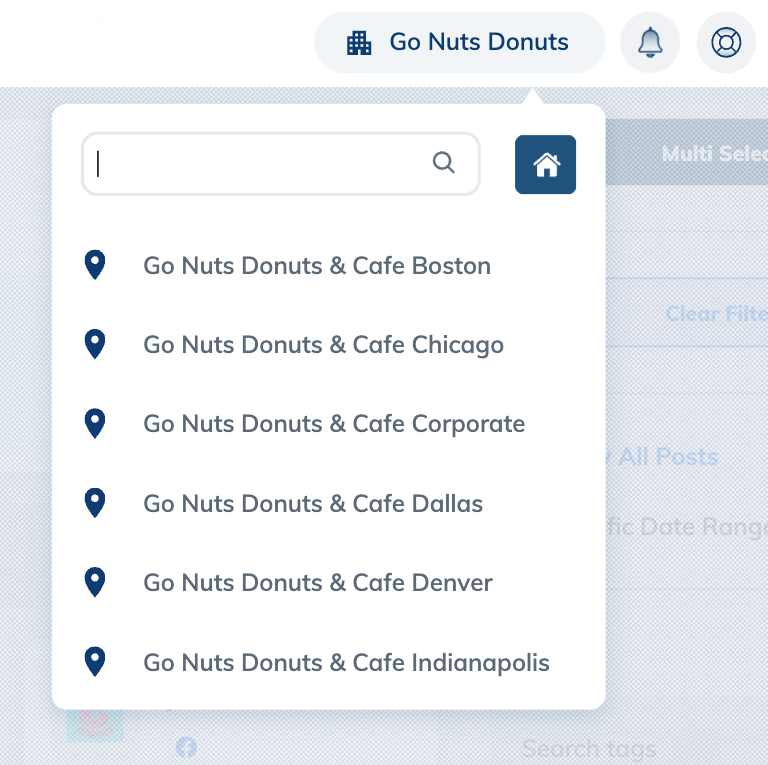
Consistency is key to any strong social strategy, and Rallio’s scheduling tools help you post regularly without the stress. You can plan content, maintain brand compliance across locations, and keep your messaging on point.
Review monitoring helps you stay on top of audience sentiment. It’s also critical to understand both opportunities and threats.
Whether you’re managing one brand or dozens of locations, Rallio makes it easier to act on your SWOT insights without burning out your team.
FAQs
1. What is a social media SWOT analysis?
A social media SWOT analysis is a strategic tool for evaluating your social media performance by identifying your Strengths, Weaknesses, Opportunities, and Threats. It gives you a clear picture of what’s working, what needs improvement, and where you can grow.
2. Why should I conduct a SWOT analysis for social media?
A marketing SWOT helps you make smarter decisions. It shows you where to focus your time and budget, reveals new content ideas, and prepares you for challenges like algorithm changes or increased competition.
3. How often should I update my SWOT analysis?
Most brands should update their SWOT every quarter or twice a year. You should also revisit it after launching a major campaign, rebranding, or noticing a significant shift in performance.
4. What kind of information should I include in each SWOT category?
For Strengths, include your best-performing content, platforms, and internal resources. For Weaknesses, note underperforming areas, resource gaps, or strategy issues. For Opportunities, list new platforms, trends, or audience segments. For Threats, consider algorithm changes, competitor moves, and external challenges.
5. Do I need analytics or a tool to run an effective SWOT?
You don’t need a tool, but access to analytics makes your SWOT analysis much more accurate and actionable. Data helps you move beyond gut feelings and make decisions based on real performance. Tools like Rallio make gathering and interpreting that data much easier.
Rallio + SWOT Analysis = Social Media Success
A social media SWOT analysis isn’t just a planning exercise. It’s a reality check. It helps you stay strategic, stay adaptive, and stay ahead of the competition.
Don’t wait for your results to stall before you take a closer look. Run your own analysis today and use what you learn to build a social strategy that’s smarter, stronger, and more aligned with your goals.
Want to simplify your social media management and make SWOT-driven decisions easier? Learn more about how Rallio can help you stay consistent, track performance, and grow your brand across every platform. Get started today!

Olivia Reck is an Account Specialist at Rallio, Powered by Ignite Visibility, where she supports the support team, account managers, and leadership to ensure clients receive top-tier service and results. Since joining Rallio in 2022, Olivia has developed a strong understanding of the company’s mission and a passion for helping brands grow. She holds a degree in Communications from California State University, Long Beach. She loves collaborating with others, learning new things about marketing and technology, and finding innovative ways to drive engagement and success.


